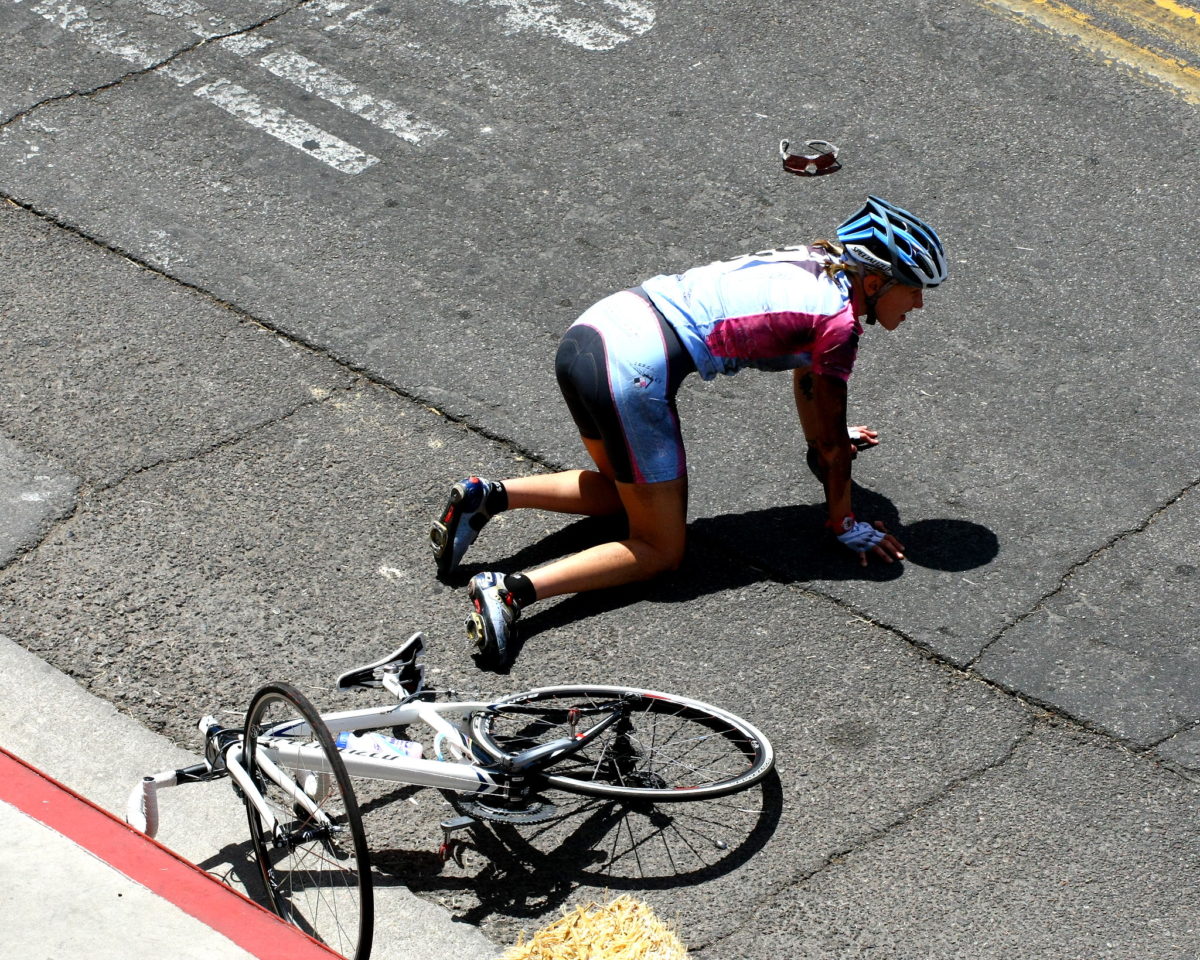
Although the month of May is recognized as National Bike Month, anyone paying attention to Nevada in September would be forgiven if they mistook the ninth month of the year as a period of bike celebration in its own right. [1] While this is undoubtedly a time when cycling enthusiasts are giving thanks for the Silver State’s long season of bicycle-friendly weather, this is also a moment for reflection on the intersection of Nevada’s bike culture and the frequency of car-bicycle accidents.
Nevada Cycling Deaths: Not the Best, Not the Worst
According to data from the National Highway Transportation Safety Administration (NHTSA), a federal agency that tracks crash data and raises awareness about automotive safety, Nevada had six fatal cycling accidents in the year of 2016. (The NHTSA uses the term “pedalcyclist fatalities,” which encompasses deadly bicycle crashes as well as car accidents involving “other cyclists including riders of two-wheel, nonmotorized vehicles, tricycles, and unicycles powered solely by pedals.”) Those six bicycle accident deaths resulted in a statewide rate of 2.04 pedalcyclist fatalities per one million people. That is a higher rate than the frequency of deadly bike accidents in 31 other states. (That includes the states of Hawai’i and South Dakota, neither of which had any bike fatalities in the year of reference.) [2]
These are sobering statistics for the Silver State, and it is worth mentioning that cycling fatalities made up nearly 2 percent of Nevada’s total fatal automobile accidents in the reference year of 2016; this is a non-negligible share of the total makeup of fatal car accidents in Nevada, given that most observers would agree that car-on-bicycle accidents are something of a “freak” occurrence. [3]
On the other hand, Nevada’s rate of fatal bicycle accidents is lower than the national average of 2.60 per one million people, a figure that is clearly dragged upward by several states with significantly higher rates of deadly bicycle crashes than in most other states. Arizona’s 31 deaths made for a rate of 4.47 fatalities per one million people, California’s 147 deaths constituted a rate of 3.75, Louisiana’s 22 deaths were 4.70 per one million people, and South Carolina’s 25 deaths yielded a rate of 5.04 per one million people. The outlier by far is Florida, where 138 cycling fatalities constituted an overall rate of 6.69 such deaths per one million people; these deaths made up more than 4 percent of all deadly accidents in the Sunshine State. [4]
Without more granular details about the causes of these deaths, it is difficult to say what social or policy differences explain the wide discrepancies among states’ rates of cycling fatalities. If recreational cyclists are being overtaken and struck on open highways, then useful correctives might include laws that require drivers to pass cyclists with an adequate berth; Nevada law requires motorists to pass with at least three feet of space and to change lanes when passing if possible. [5] But Nevada also continues to battle a high rate of pedestrian fatalities, many of which occur in designated crosswalks. To the extent that this phenomenon is relevant to cycling accidents, it may be that many bicycle riders would otherwise be walking. Bicycles are an all-access form of locomotion for those who want to get from A to B faster than they could on foot, and that means that children (who are harder to see) and people with suspended driving privileges (who may continue to struggle with substance abuse issues and may engage in drunken cycling) are included among those who bike as a form of transportation. Protecting these cyclists is more of a general roadway-safety challenge, with enforcement of laws against drunk driving, distracted driving, and other infractions possibly holding the key to safer streets.
A Strong and Growing Bike Culture
Despite having a rate of deadly bike accidents that is in the upper half of the nation’s states, Nevada also has a strong and growing culture that favors cycling. The Edible Pedal 100 just wrapped up its eighth annual event on September 15. Launched in 2011 with the motto “Ride Hard. Eat Well. Give Back,” the annual ride traverses the Carson City-Lake Tahoe region and showcases local food from across Northern Nevada. [6] This last year’s ride included a number of options for riders of varying abilities and inclinations, including:
- 10-mile leisure ride (elevation gain 552 feet)
- 32-mile ride (1,795 feet)
- 50-mile ride (2,832 feet)
- 74-mile ride (3,376 feet)
- 100-mile ride (6,879 feet) [7]
The cycling culture in Reno has been transformed by the Reno Bike Project, a nonprofit organization that promotes access to cycling in various ways including a community bike shop for riders to learn how to repair and build bikes under supervision. The cooperative structure has also taken root in the Las Vegas area through Crank and Grind. [8]
Nevada has long been home to the Silver State 508, a grueling ride from Reno along Nevada’s “Loneliest Highway” 50. Dubbed the “Toughest 48 Hours in Sport,” the ride can be completed solo or in teams of two or four. [9] Another favorite of the pain-for-gain crowd is the Death Ride, a tour of the “California Alps” that takes place just across the Nevada border in the town of Markleeville, Cal. [10]
With all this frenetic cycling energy, enthusiasts of two-wheeled transport are much at home in Nevada. If you or a loved one have been hurt or killed in a Nevada bicycle accident, contact an experienced personal injury lawyer for advice on your legal rights.
[1] https://bikeleague.org/events/bike-month/
[2] https://crashstats.nhtsa.dot.gov/Api/Public/ViewPublication/812507
[3] Ibid.
[4] Ibid.
[6] http://www.ediblepedal100.org/about-the-edible-pedal-100-century-ride/what-is-the-edible-pedal-100
[7] Ibid
[8] https://www.facebook.com/CrankAndGrindLV
Image Credit: Bill Morrow Image license here


